
Earnings Per Share (EPS) is a crucial element in a company’s profit. Calculated by dividing net income by the number of common shares outstanding. Basically, Earnings Per Share shows how much money each shareholder made for each of her shares. In reality, this money doesn’t get paid back to the shareholder. Instead, most is reinvested in future operations of the company. The net income or loss is added to the retained earnings number on the balance sheet.
[ez-toc]
Earnings Per Share Definition (EPS)
Earnings Per Share (EPS) is an essential measure of a company’s profit. It is calculated by dividing net income by the number of common shares outstanding. A higher number of Earnings Per Share (EPS) indicates a more profitable company. While Earnings Per Share (EPS) is often a helpful metric for evaluating companies, it is also essential to consider certain aspects. For example, if two companies have the same number of outstanding shares, but A has higher Earnings Per Share (EPS), then company A is performing better.
Earnings Per Share Calculation (EPS)
How to calculate Earnings Per Share
The Basic Earnings Per Share (EPS) is calculated by dividing net income by outstanding shares. For example, if a company has 200,000 shares of common stock, its Earnings Per Share (EPS) would be $3.50. The P/E ratio would be 10 because the Basic Earnings Per Share (EPS) is based on a company’s common stock. However, if a company has preferred stock, it must deduct the dividend from its basic EPS.
While Earnings Per Share (EPS) is an important metric, it only reveals a little about the company’s internal accounting practices. For this reason, it is used alongside other financial ratios and information to get a clearer picture of a company’s future performance. It is a crucial component of investment analysis, so ensure you understand the metric before investing.
Earnings Per Share Formula
Earnings per share value is calculated as net income (also known as profits or earnings) divided by available shares. A more refined calculation adjusts the numerator and denominator for shares that could be created through options, convertible debt, or warrants. The numerator of the equation is also more relevant if it is adjusted for continuing operations
EPS formula = (Net Income – Preferred Dividends) / Weighted Average Number of Common Shares
Because EPS relates to earnings accessible to common shareholders, the current year’s preferred dividends are deducted from net income. Dividends on ordinary stock are not deducted from net income.
Because the number of outstanding common shares varies during the year, EPS is calculated using a weighted average. The weighted average number of common shares is determined by dividing the amount of shares outstanding during the year by the number of years they were outstanding. As a result, analysts must calculate the equivalent number of entire shares outstanding for the year.
There are three steps to calculating the weighted average number of outstanding ordinary shares:
Determine the initial balance of common shares and the changes in common shares throughout the course of the year.
For each change in the number of common shares:
Step 1
Determine the number of outstanding shares following each change in the common stock. The issue of new shares raises the number of outstanding shares. The buyback of shares lowers the number of outstanding shares.
Step 2
Divide the number of outstanding shares by the number of months between this change and the next change: weight = days outstanding / 365 = outstanding months / 12
Step 3
Add up the weighted average number of outstanding common shares.
Diluted Earnings Per Share (DEPS) vs Basic Earnings Per Share (BEPS) Basic EPS vs Diluted EPS
Earnings Per Share Basic vs Diluted
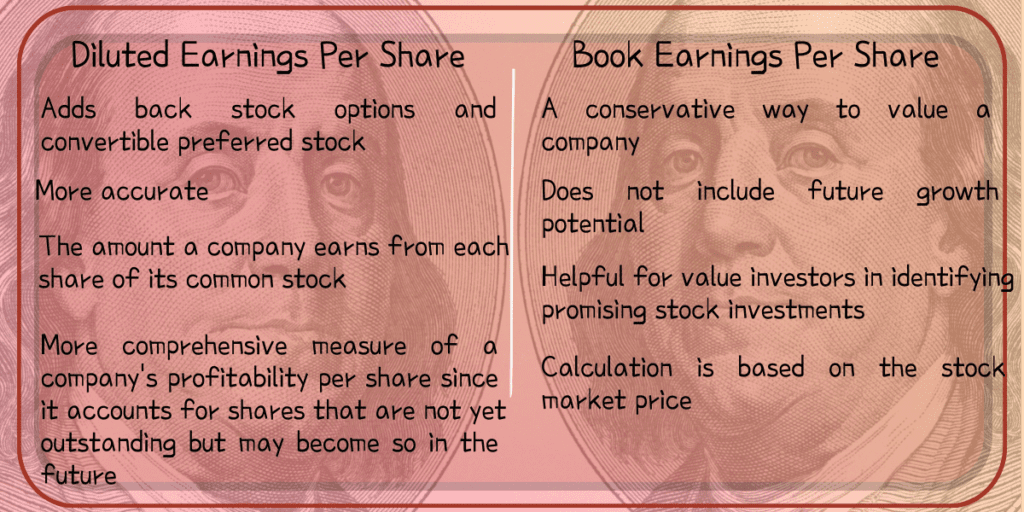
Earnings Per Share Basic vs Diluted, the Diluted Earnings Per Share (EPS) differs from the Basic Earnings Per Share (EPS) in several ways. The Diluted version adds back stock options and convertible preferred stock, making Diluted Earnings Per Share (EPS) more accurate. The diluted version also accounts for the value of convertible securities. In this way, diluted EPS also reflects a company’s total outstanding shares.
In addition to the EPS, a company can issue a diluted version of its results. The Diluted version includes convertible and warrant shares and other dilutive instruments. The Diluted Earnings Per Share (EPS) is generally considered the more expanded version of the Basic Earnings Per Share (EPS). Investors need to understand the difference between Basic and Diluted Earnings Per Share (EPS).
Earnings Per Share (EPS) is a crucial metric for measuring a company’s profitability. Divided by the number of outstanding shares, EPS tells investors how much profit a company has made in a given period. A high Earnings Per Share (EPS) indicates a profitable company. On the other hand, a low Earnings Per Share (EPS) means a low return on investment.
Diluted Earnings Per Share (DEPS)
Diluted Earnings Per Share (EPS), or Diluted EPS, is the amount a company earns from each share of its common stock. It differs from Basic Earnings Per Share (EPS) in a few ways. First, the number of common shares outstanding is adjusted for dilutive securities. These securities include shares that a company issues as compensation to its employees.
Second, the denominator of Diluted Earnings Per Share (EPS) is calculated using the Treasury Stock Method, which assumes that the proceeds from an option tranche are used to repurchase the shares at the current share price.
Diluted Earnings Per Share (EPS) is a more comprehensive measure of a company’s profitability per share since it accounts for shares that are not yet outstanding but may become so in the future, attributing to the issuance of convertible securities or employee stock options. Nevertheless, the issuance of convertible securities dilutes a company’s overall profits and reduces per-share profitability. Regardless, a higher diluted EPS generally indicates a more profitable operation for each shareholder.
In addition to a company’s basic EPS, diluted EPS is also used to judge the quality of a company’s financial results. However, diluted EPS is more complex to calculate and can be less accurate than basic EPS. Therefore, users need to decide which is better for them based on the context in which they plan to use the figures.
Diluted EPS is calculated by dividing net income by the weighted average number of outstanding shares, including the impact of stock options, convertible preferred stock, and warrants. Underwater stock options are excluded from the calculation, but eligible stock options have a strike price below current market prices.
Diluted EPS is a valuable tool for investors who want to understand the quality of a company’s earnings. It is calculated by dividing net income by the weighted average number of outstanding common shares. For example, if Company ABC had a $50 million net income over the past year but had no dividends, the diluted EPS would be less than the previous EPS. Employee stock options and convertible preferred shares also dilute EPS.
Diluted EPS is calculated by deducting the effects of convertible bonds and options from the basic EPS. The basic EPS of $0.9556 would be diluted to $0.9536.
Book Earnings Per Share (BEPS)
Book value earnings per share (BVPS) is a conservative way to value a company. It does not include future growth potential and only benefits current financial conditions. Nevertheless, it is helpful for value investors in identifying promising stock investments. This calculation is based on the stock market price.
Book value earnings per share can be calculated in different ways. The basic form is calculated by dividing net income by the number of outstanding common shares. The diluted form takes into account potential dilution. This method gives a complete picture of a company’s financial performance. The diluted form also includes non-core operations.
The value of a company’s stock is a crucial metric in evaluating its performance. Using book value earnings per share, an investor can determine whether a stock is overvalued or undervalued. During bull markets, a stock will trade higher than its book value, while during bear markets, it will trade closer to the market value.
Calculating book value per share is straightforward for companies with only common stock outstanding. Divide total stockholders’ equity by the total common shares outstanding during the accounting period. However, this calculation can only be accurate if a company has tangible assets. In addition, it cannot reflect losses incurred on equity investments.
Book value earnings per share are one of the most essential metrics when investing in stocks. Value investors use it to determine whether a stock is undervalued or overvalued. A stock with a high book value per share is likely undervalued. Alternatively, a low book value per share can be a good investment.
Book value earnings per share is a critical measure of a company’s profitability. If book value earnings per share are high enough to calculate the value of each share, a company may be able to pay out higher dividends. But if earnings per share are low, it may be time to sell. As a result, it is crucial to understand what a company is worth and how it can increase its book value.
Book value earnings per share can be calculated by dividing total book value by the number of outstanding common shares. However, it is important to subtract preferred shareholders’ equity from total equity; otherwise, the calculation would be inaccurate. It is also important to note that the analysis should be based on the average number of shares outstanding at the end of a given period. Otherwise, short-term events may cause the value to skew negatively.
Adjusted Earnings Per Share (AEPS)
In addition to diluted earnings per share, companies sometimes present Adjusted Earnings Per Share (AEPS) to investors as a measure of their overall performance. This non-GAAP measure of earnings excludes items normally included in the calculation of traditional earnings per share. These items include acquisition-related charges, restructuring and other charges, and tax-sharing income related to prior period tax returns.
Adjusted earnings are usually calculated by subtracting preferred dividends from net income and dividing this figure by the number of outstanding shares. For example, suppose a company has $1,000,000 in net income, no preferred shares, and 50,000 shares of common stock outstanding. Therefore, the company’s EPS equals 50,000 divided by XYZ’s net income.
While adjusted earnings are generally not considered a substitute for the corresponding GAAP measure, the non-GAAP measure has certain advantages for companies. For example, companies can manipulate adjusted earnings reports by omitting basic day-to-day operating expenses, thereby allowing companies to understand better their overall financial performance, which may be necessary to investors.
Adjusted earnings per share is an essential metric for investors, and the numbers may help them decide whether to purchase or sell shares of a company. For example, a company may have been earning $1 per share in one year but lost the following year. Using the adjusted EPS, investors and securities analysts can determine if it is worth investing in that company.
Unlike basic EPS, diluted EPS is calculated using the weighted average of common shares outstanding. Dilutive securities increase the number of common shares, and the denominator is adjusted to account for the effects of these securities on the company’s earnings. The denominator for diluted EPS uses the treasury stock method, which assumes that the proceeds from the exercise of option tranches are used to repurchase shares at their current price.
Adjusted EPS is a better measure of profitability. It considers dilution from stock options, convertible securities, and minority interests. It also allows a company to compare its performance to other companies.
Earnings Per Share vs Dividend
What do earnings per share mean
Dividends and Earnings Per Share are two important financial indicators that help investors to assess the performance of a company.
Shareholders are not able to access the profits of their companies. As such, EPS can be tracked and analysed by anyone, including shareholders. Shareholders can monitor the performance of a company from a number of different sources. EPS is one of those sources, but it s not the only one. A shareholder can also view key financial data, such as revenue and earnings per share, through a web browser on any computer or mobile device.
This allows them to see how well their investments are performing, and if they are doing well or not so well. They also have access to historical data that shows how their investments have done over time and what they may have done better than expected in the past.
Although earnings Per Share (EPS) is actually extensively utilized as a technique to track a firm’s performance, Investors do not possess direct access to those profits. A section of the revenues may be distributed as dividends, however a portion of the EPS may be retained by the firm. Investors by means of representatives on the board of directors would certainly have to change the portion of EPS that is actually distributed through means of dividends to access more of those profits incomes.
Basically, Earnings Per Share shows how much money each shareholder made for each of her shares. In reality, this money doesn’t get paid back to the shareholder. Instead, most is reinvested in future operations of the company. The net income or loss is added to the retained earnings number on the balance sheet.
Any dividends declared per share appear on the income statement under the earnings per share information. You find the amount of dividends paid on the statement of cash flows. The company’s board of directors declares dividends either quarterly or annually.
Merits of Earnings Per Share (EPS)
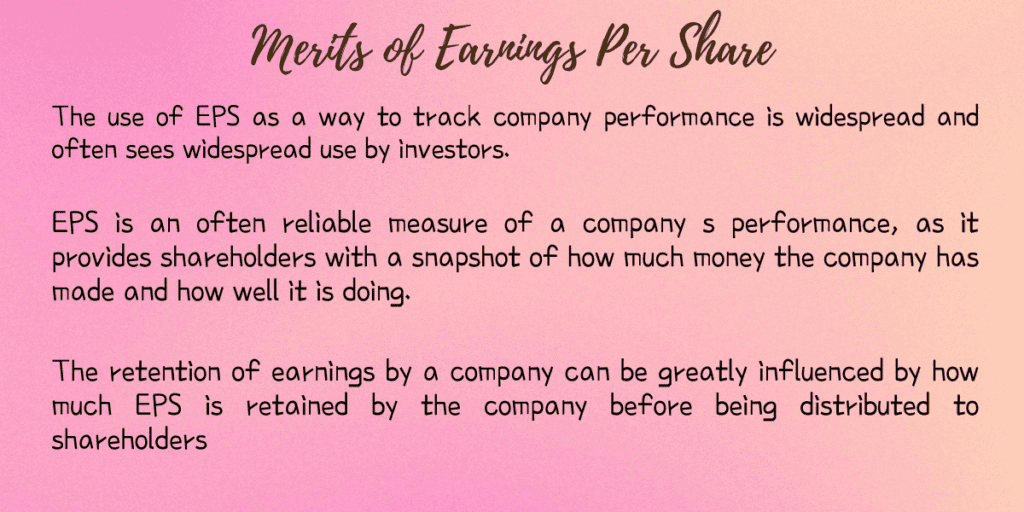
1. The use of EPS as a way to track company performance is widespread and often sees widespread use by investors.
2. EPS is an often reliable measure of a company s performance, as it provides shareholders with a snapshot of how much money the company has made and how well it is doing.
3. Some dividends may be distributed in lieu of EPS, but as a whole, EPS is still a valuable tool for investors to track a company s performance.
4. The retention of earnings by a company can be greatly influenced by how much EPS is retained by the company before being distributed to shareholders.
5. There are many companies that release detailed financial information on an issuer s website, making the process of downloading and studying this data much easier for investors.
Stock Dividends & Stock Splits vis-a-vis EPS
Stock dividends and stock splits simply affect the units of measurement, not the ownership of earnings, when computing the weighted average number of shares. A stock dividend or a shareholder split).
When a stock dividend or split occurs, the weighted average number of shares must be restated to reflect the shares outstanding prior to the stock dividend or split. As a result, it is not weighted by the period of the year after the stock dividend or split.
Before beginning the three phases of determining the weighted average, the following figures are repeated to account for the implications of the stock dividend/split:
The starting balance of outstanding shares; All shares issued or acquired prior to the stock dividend or split are restated; no shares issued or purchased after the stock dividend or split are restated.
If a stock dividend or split happens after the end of the fiscal year but before the financial statements are prepared, the weighted average number of shares outstanding for the year (as well as any prior years reported in comparative form) must be restated.
Earnings Per Share and Stock Valuation
Earnings indicate a company’s profitability and are regarded as the most crucial measure of its financial health. Earnings are reported by publicly traded firms four times a year, and we observe that research analysts and investors actively monitor this earnings season. Growing profits per share (EPS) is a metric of a company’s excellent performance and, in some ways, a gauge of investor returns.
The widely followed Wall Street PE Multiple or Price/EPS ratio directs EPS to the stock markets. The lower the PE multiple in comparison to the industry average PE, the better the investment and valuation prospects. Because of the same link, stock prices react dramatically to quarterly results.
EPS and Price-to-Earnings (P/E)
Although in surprising ways, comparing the P/E ratios within an industrial sector might be useful. Although it could appear that a company that is more expensive relative to its EPS when compared to its competitors is “overvalued,” the contrary is more often the case. Investors are prepared to pay more for a company if it is anticipated to expand or beat its competitors, regardless of its past earnings per share. In a bull market, it is typical for the companies in an index with the highest P/E ratios to do better than the index as a whole on average. EPS Ratio.
Conclusion
Earnings Per Share (EPS) is actually an essential profitability measure used in associating a stock’s price to a firm’s true earnings. In general, higher EPS is a lot better but the investor has to think about the number of shares outstanding, the capacity for share dilution, and earnings fads over time. If a provider overlooks or trumps analysts’ consensus desires for EPS, their portions may either crash or even move, relatively.
Related Reads
MARKET CAPITALIZATION 2022 : The Best Performance Indicator
DEBT : 4 Steps to Get Out of it forever, Don’t miss the 3rd
INTRINSIC VALUE 2022 : The 3 Best Investing Scenario
WARREN BUFFETT : Oracle of Omaha, His best 3 best holdings
VALUE INVESTING 2022 : Invest Like the Best Investors
4 thoughts on “EARNINGS PER SHARE : 3 Best EPS Indicators & Calculator”